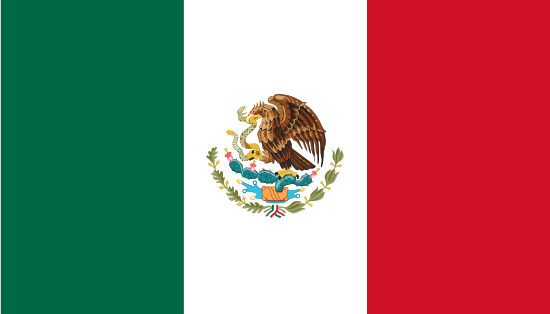
Mexico

  • President:Andres Manuel Lopez Obrador
  • President of the Senate:Olga Sánchez Cordero
  • Capital city:Mexico City (Distrito Federal)
  • Languages:Spanish only 92.7%, Spanish and indigenous languages 5.7%, indigenous only 0.8%, unspecified 0.8% note: indigenous languages include various Mayan, Nahuatl, and other regional languages (2005)
  • Government
  • National statistics office
  • Population, persons:128,927,016 (2024)
  • Area, sq km:1,943,950
  • GDP per capita, US$:11,497 (2022)
  • GDP, billion current US$:1,465.9 (2022)
  • GINI index:43.5 (2022)
  • Ease of Doing Business rank:60

All datasets: C F O
  • C
    • October 2023
      Source: Food and Agriculture Organization
      Uploaded by: Knoema
      Accessed On: 31 October, 2023
      Select Dataset
      Food supply data is some of the most important data in FAOSTAT. In fact, this data is for the basis for estimation of global and national undernourishment assessment, when it is combined with parameters and other data sets. This data has been the foundation of food balance sheets ever since they were first constructed. The data is accessed by both business and governments for economic analysis and policy setting, as well as being used by the academic community.
  • F
    • March 2024
      Source: Food and Agriculture Organization
      Uploaded by: Knoema
      Accessed On: 18 March, 2024
      Select Dataset
      Value of gross production has been compiled by multiplying gross production in physical terms by output prices at farm gate. Thus, value of production measures production in monetary terms at the farm gate level. Since intermediate uses within the agricultural sector (seed and feed) have not been subtracted from production data, this value of production aggregate refers to the notion of "gross production". Value of gross production is provided in both current and constant terms and is expressed in US dollars and Standard Local Currency (SLC). The current value of production measures value in the prices relating to the period being measured. Thus, it represents the market value of food and agricultural products at the time they were produced. Knowing this figure is helpful in understanding exactly what was happening within a given economy at that point in time. Often, this information can help explain economic trends that emerged in later periods and why they took place. Value of production in constant terms is derived using the average prices of a selected year or years, known as the base period. Constant price series can be used to show how the quantity or volume of products has changed, and are often referred to as volume measures. The ratio of the current and constant price series gives a measure of price movements. US dollar figures for value of gross production are converted from local currencies using official exchange rates as prevailing in the respective years. The SLC of a country is the local currency prevailing in the latest year. Expressing data series in one uniform currency is useful because it avoids the influence of revaluation in local currency, if any, on value of production
  • O
    • December 2023
      Source: Organisation for Economic Co-operation and Development
      Uploaded by: Knoema
      Accessed On: 12 January, 2024
      Select Dataset
      The Agricultural Outlook has been prepared as a joint report by the Organisation for Economic Co-operation and Development (OECD) and the Food and Agriculture Organization (FAO) of the United Nations. The report provides a ten year forward looking, assessment of trends and prospects in the major temperate-zone agricultural commodity markets of biofuels, cereals, oilseeds and oilseed products, sugar, meat, fish and sea food, dairy products, cotton, roots and tubers and pulses. It is published annually, in the middle of the second quarter, as part of a continuing effort to promote informed discussion of emerging market and policy issues. The data used to develop the projections underlying the assessment are those available as of January 2023. The projections and assessments provided in the report are the result of close co-operation between the OECD and FAO Secretariats and national experts with a jointly developed modelling system, based on the AGLINK-COSIMO model, used to facilitate consistency in the projections. The data series for the projections are drawn from OECD and FAO databases. For the most part information in these databases has been taken from national statistical sources. For further details on particular series, enquiries should be directed to the OECD and FAO Secretariats.