(29 March 2021) Poor weather conditions and lack of visibility resulted in a giant 200,000-ton container ship, Ever Given, blocking the Suez Canal for almost a week, from Tuesday, March 23 to Monday, March 29. Since the Suez Canal is the most important trade route connecting Europe and North America in the North and the Middle East and Asia in the South, the blockage halted a significant proportion of global trade until the ship's eventual release early this morning.

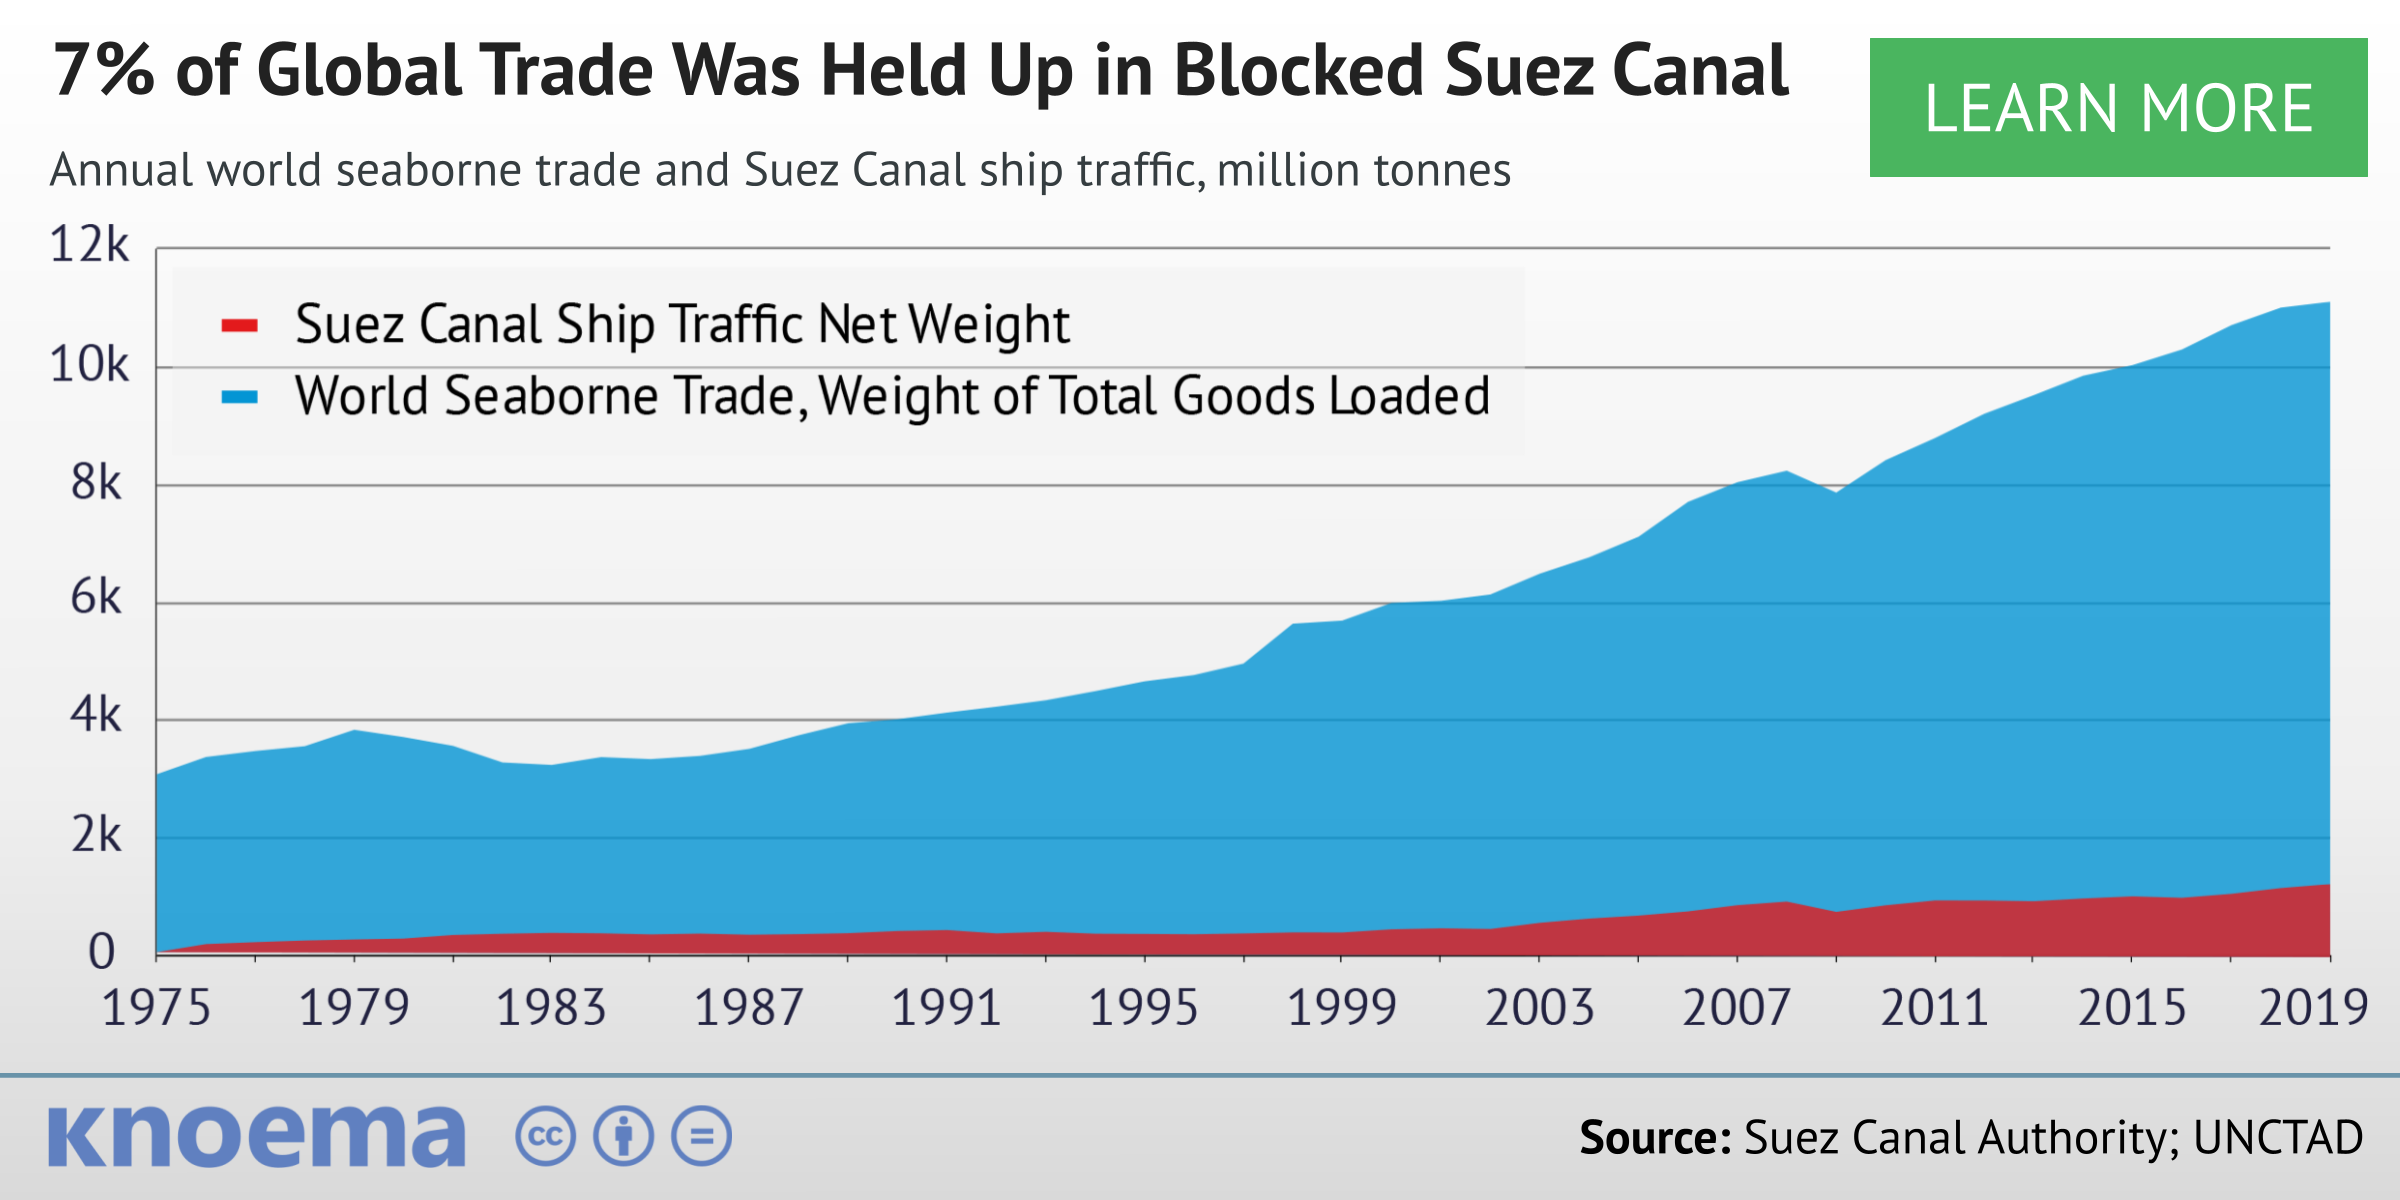
  • The annual cargo shipped through the Suez Canal in both directions accounts for around 9%, by weight, of global seaborne trade, and more than 7%* of all global trade. The highest economic damage from blockage of the Suez Canal falls on Saudi Arabia, Singapore, Netherlands, China and Egypt—countries whose trade turnover through the canal exceeds 100 thousand tons per year.
  • According to the Suez Canal Authority Annual Report, a total of 107 million tons of crude oil (equivalent to 2.2 million barrels/day or 5% of world crude exports) and 53 million tons of cereals (12% of global cereals trade) went through the Suez Canal in 2019. 

*Estimates based on data for 2019.

Download our latest AUTO INDUSTRY data brief

The Automotive Data Brief reviews the most recent data to present an overall picture of the automotive sector. You can find information relating to vehicle production and sales as well as statistics about fuel prices, vehicle stocks, and the electric-vehicle market.

Related Insights from Knoema

Export Concentration Index: A Measure of Economic Vulnerability

The concentration index of exports estimates a country’s reliance on a limited group of commodities as its primary source of foreign exchange income. Ranging from 0 (perfect diversification) to 1 (concentrated on a single product)*, a comparison of index scores to the contribution of natural resources to GDP worldwide shows that countries that are resource-rich tend to have less diversified export bases. Last year Iraq’s export concentration index reached 0.97, driven by its export concentration in mineral fuels, namely oil. Other oil exporters—including Angola, Iran, Kuwait, and...

China Trade Data | Latest Official Statistics

(October 2019) China and the United States reached a partial trade deal on Friday, October 11, with the US agreeing to forgo further tariff escalation in exchange for China agreeing to resume purchases of US farm products. However, even if trade terms improve between the countries, recent preliminary figures released by China's customs office suggest Chinese exports hurt by the trade war will need time to recover to 2018 levels. Since the beginning of 2019, China exported $348 billion to the United States, 11.3 percent less than during the same period of 2018.China's exports...

World Trade Uncertainty Weighing On Global Growth

Recent analysis from the IMF cites increasing uncertainty caused by trade tensions as a primary driver of sluggish global growth, a trend which moved the IMF to issue a downward revision to its global GDP growth forecast in the July edition of the World Economic Outlook. According to IMF estimates, the escalation of trade uncertainty observed this year could consume around 0.75 percentage points of global growth in 2019. To track trade tensions globally, the IMF and Stanford University teamed up to develop the World Trade Uncertainty Index (WTU).* This index measures trade...

US Agricultural Exports to China Falling, Farmers Seek New Markets

Ask any American soybean farmer about current market conditions and US-China trade frictions will bubble up in the conversation. After the late June meeting between presidents Xi Jinping and Donald Trump in Osaka, Trump assured American farmers that trade talks would resume and that China would buy a tremendous amount of food and agricultural products very soon. Yet, in the month since, no significant purchases have been announced and no information is publicly available on large purchases in the offing, especially now, as the trade-war escalated again with the new 10-percent...