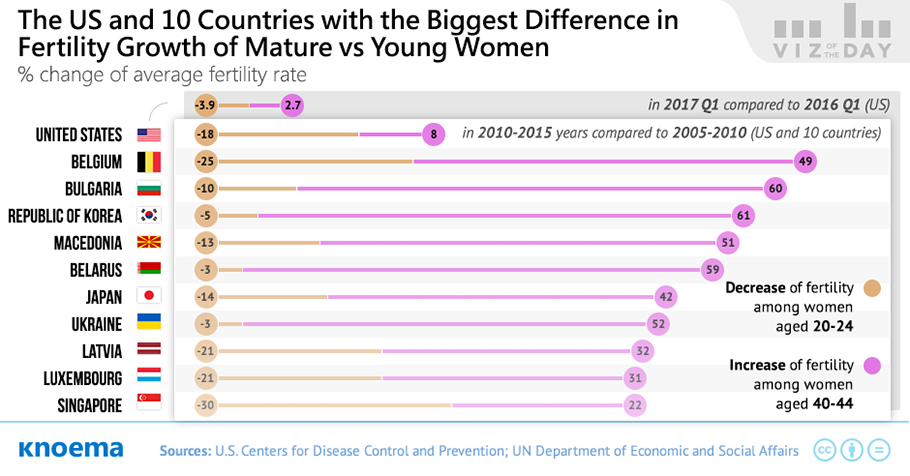
US fertility rates hit the lowest level ever recorded during the first quarter of 2017, reflecting both biological and social changes among the population, including delaying child-bearing and electively choosing not to have children. The current downward trend started in 2007-2008 shortly before the global economic crisis, which could have affected financial resources and planning decisions, and has only recently slowed to a decrease of about 1 percent annually as of 2015.

  • During the first quarter of 2017, the general fertility rate in the US fell to 57.7 birth per 1,000 women aged 15-44 years, a decrease of 5.9 percent from the previous quarter and 3.8 percent compared to the same period of 2016. US women aged 40-44 years were an outlier, with the birth rate among these women continuing to increase slightly during the first quarter by almost 1 percent. 
  • In 2015, the United States ranked 138th of 202 economies globally by total fertility rate, according to the World Bank, a slightly lower rate than Scandinavian countries Sweden and Denmark. 
  • African countries have the highest fertility rates globally, making up 14 of the top 15 countries by births per 1,000 women. Afghanistan was ranked 14th in 2015.

US fertility patterns, like those of many other developed countries, highlight differences in social norms that contribute to divergent fertility rates relative to global trends. For example, according to the US Centers for Disease Control and Prevention, the most popular age for childbirth is women aged 30-34 years, a recent shift from the 25-29 year old age group. By comparison, the global average is a full decade younger, with women aged 20-24 years old giving birth at higher rates than any other age group.

  • Social motivations—including work-life balance, educational attainment, and other factors—as well as the availability of maternal care for older mothers and babies born prematurely in the United States has supported growth in the fertility rate of US women aged 40-44 while globally this age group has the lowest fertility rate of all age groups and a negative growth rate.

Socio-economic factors and government policies create financial incentives and social safety nets for families that influence fertility rates while also alter life expectancy and immigration trends that ultimately determine net population growth. For many economies globally, including the US, declining fertility rates are likely a new permanent dynamic in government planning. 

  • The largest decline in US fertility rates during 2016 was among teens, suggesting that US policies targeting fewer teen pregnancies have been successful, on average. Births to teenagers aged 15-17 and 18-19 years old decreased by 10.8 percent and 8.5 percent year-over-year, respectively.
  • While fertility rates among US women aged 35-39 had been trending upward, the first quarter 2017 rate declined to early 2015 levels.
  • Only nine US states showed a positive change in the number of live births in 2016, 15 fewer states than in 2015 and 36 fewer than in 2014. Four US states had more deaths than births as well as the lowest growth rates in live births: West Virginia, Maine, Vermont and (the US territory of) Puerto Rico.

Related Insights from Knoema

US Population by Age and Generation in 2020

Gen-Z has overtaken Millennials by nearly 4 million to become the largest generation in the United States. Baby Boomers are the third-largest generation with the population of 69 million persons in 2020. With a current population of around 86 million, the Gen-Z generation is expected to grow to 88 million over the next 20 years because of migration, according to the United Nations' latest World Population Prospects. The boundaries that define generations are not universally agreed, and yet these boundaries carry important implications in business and government. The size,...

Top Vehicle Manufacturers in the US Market, 1961-2016

Over the last three years, car sales in the US market have set new all-time records and included a collection of manufacturers that extends well beyond the American classics. In 2015, vehicle sales in the US reached nearly 17.5 million units, a growth of 5.7 percent from 2014 and 25,000 more vehicles than the record setting sales in 2005. The year 2000 marked a turning point in the US auto industry: it was the last year that General Motors and Ford Motor Company combined made up at least 50 percent of the US market share. GM’s share of the US market has decreased almost 3 times...

Active Hate Groups in the United States, 2003-2015

In 2015, at least 892 "hate" groups were operating throughout the United States, according to Southern Poverty Law Center (SPLC). This represents a 14 percent increase from the 784 groups recorded a year before. Still, the current figures are lower than the all-time high in 2011 as traditional organised extremism continues to shrink in favor of collective and individual cyber-based activism. The SPLC defines a hate group as an organised movement that has beliefs or practices that attack or malign an entire class of people based on religion, race, sexual orientation, gender,...

Coronavirus and the US Consumer by Prosper Insights & Analytics

Prosper Insights & Analytics has 18 years of experience producing market leading monthly survey-based research of consumers' overall confidence. In its most recent survey, Prosper asked consumers about their concerns with regard to the coronavirus pandemic and the related cancellation of major events. You can explore Prosper's latest findings in depth below, but we'll give the spoiler: 82% of US consumers expressed one form of concern or another and believe that they will somehow experience direct consequences of the pandemic. Moreover, for the first time in six months there is...