On November 8, US citizens will go to the polls to elect the 45th president of the United States. Predictions of which ticket will win the election and by what margin abound. These predictions should, but do not always, have one thing in common: data. If global events of this decade teach us anything, it’s that seemingly small challenges to the status quo, local sentiment globalized by social media, and many other “unpredictables” can turn the tide quickly and irrevocably.

Data, new and old, still has a role to play in understanding US voter turnout, key election issues, and the strength ultimately of the US democratic system. We at Knoema have brought together historical and the latest statistical data from a variety of sources, sorted into five topical categories complete with interactive visualizations to make navigation through data easier. These topics are: 1 - the 2016 elections; 2 - campaign financing; 3 - election preferences & presidential job approval; 4 - voting history; and 5 - gender differences.

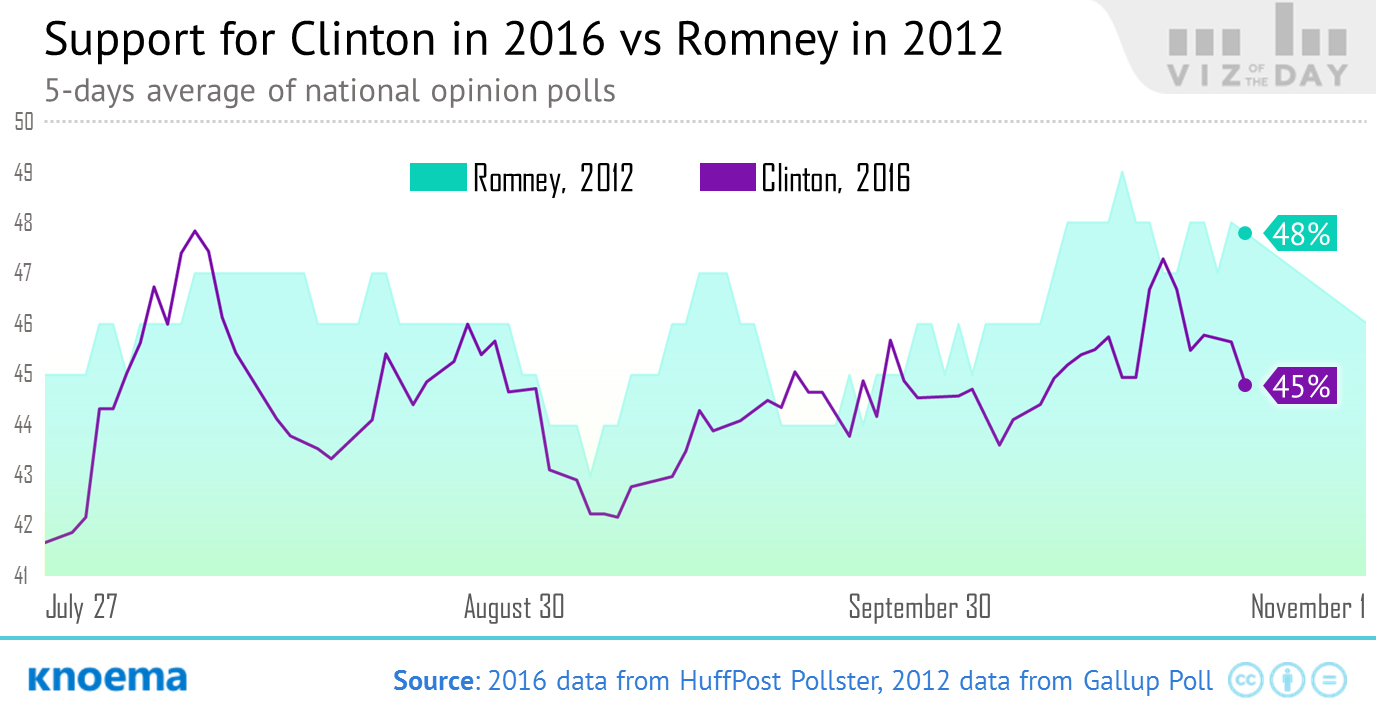
One thought provoking - and perhaps "get out to vote" worthy - finding from this data collection is that polling trends in favor of Hillary Clinton look similar to that of Mitt Romney during the last 100 days before the 2012 US presidential election. And, yes, you've guessed it, Donald Trump seems to be following the pattern of President Obama. Extending this scenario out through the final two weeks of the campaign, Trump's chances of winning the election get stronger: President Obama gained his decisive advantage over Romney in the last two weeks of the 2012 campaign.

As a bonus, we have added special coverage at the bottom of this page to share information on the length of political party platforms, presidential vetoes, and host cities of the political parties' national conventions.

Related Insights from Knoema

US Official Statistics and President Trump

In 2016, Donald Trump promised to reduce taxes and drive rapid economic growth, get rid of federal debt and create new jobs. Over the duration of his presidency, he's made new pledges and claims that can—and frequently are—cross-checked with official data. Today we're tapping into our deep catalog of official US government data to share a couple of examples of how you can use this data to evaluate some of the pledges and claims of President Trump to answer, "How is that working out?"

2016 US General Elections: Latest Polls

The 58th United States presidential election that is scheduled for November 8, 2016, will determine 45th President and 48th Vice President of the United States. The candidates were selected during the primary elections held between February and June 2016. The Republican Party nominated Donald Trump, a businessman and reality television actor with no experience as an elected political official. The Democratic Party nominated Hillary Clinton, whose former public positions include US Secretary of State, US Senator (NY), and First Lady of the United States. Polls out this week report...

US Presidential Elections: Gender Gap

Gender differences in voter turnout, views on presidential performance, party identification, and attitude towards public policy issues fill out the dashboard below to provide you a more nuianced perspective on this US election issue. Explore our US Presidential Elections Data Hub or jump to a specific topic of interest in our US presidential election series:

US Presidential Elections: Popular, Electoral, and Total Votes 1824-2012

The presidential election in the United States is an indirect election in which US citizens vote not directly for the President but for a set of electors known as the U.S. Electoral College who, in turn, cast ballots directly for President and Vice President. To win the vote candidate should get the majority of electoral votes. The designation of the electors by citizens is conducted in the manner of the popular vote, which takes place on the Election Day, determined to be on the first Tuesday after the first Monday in November. Thus, current 2016 United States presidential...