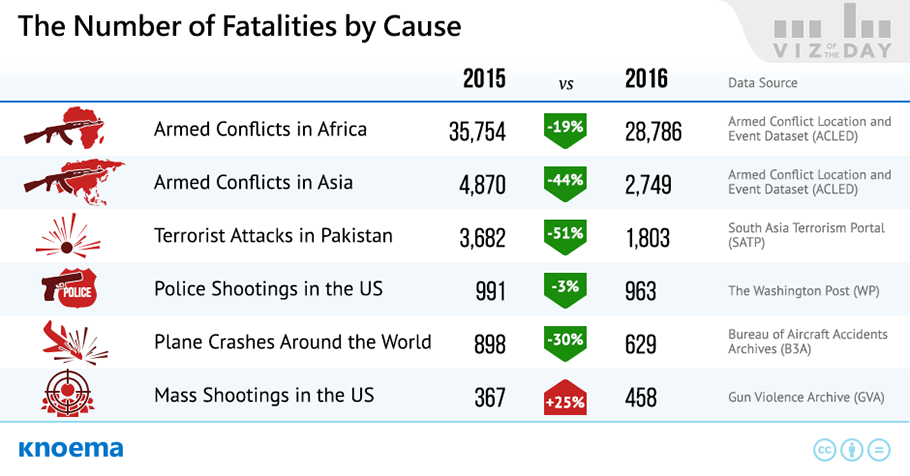
News headlines around the world inundate us with stories about terrorism, conflict, social unrest, plane crashes, natural disasters, global economic crises and more, always more. One might even think that 2016 was the worst year ever for humanity. But, was it? At Knoema, we let the data speak for itself. We have collected the most frequently updated and the most up-to-date statistics from reliable sources to take a practical view of the state of the world and how it has changed over the last year. By at least some measures, the world ended 2016 better than it ended 2015, with at least one notable exception.


Pakistan. We do not yet know if the total number of fatalities globally from terrorism decreased during 2016 because the only comprehensive database on terrorism - Global Terrorism Database - has not released 2016 data. What we do know is that the number of people internally displaced globally due to conflicts decreased by nearly 60 percent last year. In 2015, conflict displaced 7 million people globally; in 2016, this figure dropped to 3 million, according to the Internal Displacement Monitoring Centre. 

We also know that the Middle East and North Africa combined account for roughly half of all fatalities from terrorism globally. A review of data from just one country in this region, Pakistan—one of the world’s worst terrorism affected countries—shows reason for hope. Data from the South Asia Terrorism Portal suggests that the number of people killed by terrorists in Pakistan decreased by more than 50 percent in 2016 compared to 2015, shrinking from 3,682 to 1,803 total deaths.


Africa, Asia and Europe. The number of battle-related deaths in Africa and Asia decreased significantly in 2016 compared to the previous year. Data from the Armed Conflict Location and Event Data project—commonly known as ACLED—indicates that the number of fatalities in armed conflicts in Africa continued to decrease in 2016, with total fatalities falling 18 percent from 36,000 to 29,000 deaths.

In 2016, there were several violent and deadly terrorist attacks in Europe, including July's Bastille Day attack in Nice, France, which generated extensive news coverage and social responses globally. That said, in 2015, terrorism-related fatalities in Western Europe constituted less than 0.5 percent of the total number of fatalities globally from terrorist attacks.


Police Shootings in the US. Last year, the media spotlight and the US presidential campaign highlighted serious social tensions over police shootings in the US, especially those involving black Americans. Data reveals, however, that the total number of people killed by police in the United States last year decreased slightly from 991 people in 2015 to 963 in 2016.


Plane Crashes Around the World. During 2016, the world experienced several heartbreaking aviation accidents, such as: the crash of the Russian Defense Ministry TU-154 into the Black Sea that killed all 92 passengers on board; the loss of 71 people—including 19 members of a Brazilian soccer team—to the LaMia Flight CP2933 crash in Colombia; and, the Egyptair Flight 804 crash into the Mediterranean Sea that claimed 66 lives. And, yet, stepping away from the headlines, we discover that fatalities from plane crashes decreased last year by 30 percent, from 898 total fatalities to 629, according to the Bureau of Aircraft Accidents Archives.


Mass Shootings in the US.  Now we arrive at the notable exception: mass shootings in the United States. The number of people killed in this category of violent crime rose by 25 percent last year from 367 in 2015 to 458 in 2016, according to the Gun Violence Archive. Few are likely surprised by this finding. In 2016, the world witnessed the deadly mass shooting in Orlando, Florida, that claimed 50 lives and wounded 53 others; the attack in Piketon, Ohio, which killed eight, and so many more.

Emergent Risk Situation Room

Interested in a global business intelligence subscription that includes datasets, visualization tools, and real-time information for assessing risk? Check out the Emergent Risk Situation Room from our partners at ERI.

Related Insights from Knoema

Active Hate Groups in the United States, 2003-2015

In 2015, at least 892 "hate" groups were operating throughout the United States, according to Southern Poverty Law Center (SPLC). This represents a 14 percent increase from the 784 groups recorded a year before. Still, the current figures are lower than the all-time high in 2011 as traditional organised extremism continues to shrink in favor of collective and individual cyber-based activism. The SPLC defines a hate group as an organised movement that has beliefs or practices that attack or malign an entire class of people based on religion, race, sexual orientation, gender,...

The Most and Least Tolerant Countries

The World Values Survey (WVS) examines the changing values of societies and the impact of these changes on social and political life. The WVS is composed of nationally representative surveys conducted in almost 100 countries that represent almost 90 percent of the world’s population. Initiated in 1981, the WVS is the largest non-commercial, cross-national, time series investigation of human beliefs and values ever executed. The survey repository includes interviews with almost 400,000 respondents, covering all of the world’s major cultural zones. Among the dozens of questions that...

How much happiness do pets contribute in your country?

There is much love to be found in relationships between pets and their owners. And, as love influences our lives for the better, so do our pets make us happier. According to one psychological study, pet ownership improves people's happiness in a meaningful way because relationships with pets complement human relationships rather than substituting one for the other. In essence, pets increase the total happiness an owner can possibly experience. Another medical study suggests that people benefit from their pets in terms of improved health. Even if data suggests that with love...

United States: Time Use Survey

Every day we have just 24 hours to accomplish it all. And, every day we make hundreds of decisions to parse out those 24 hours. The US Bureau of Labor Statistics in its American Time Use Survey examines just how Americans divvy up their time with input gathered from over 180,000 interviewees aged 15 and older. The survey yields unique insight into"how, where, and with whom Americans spend their time”. Following are a few "how" highlights from the 2016 survey: In 2016, Americans spent an additional 11 minutes on average daily on “relaxation and leisure”, with TV viewing accounting...