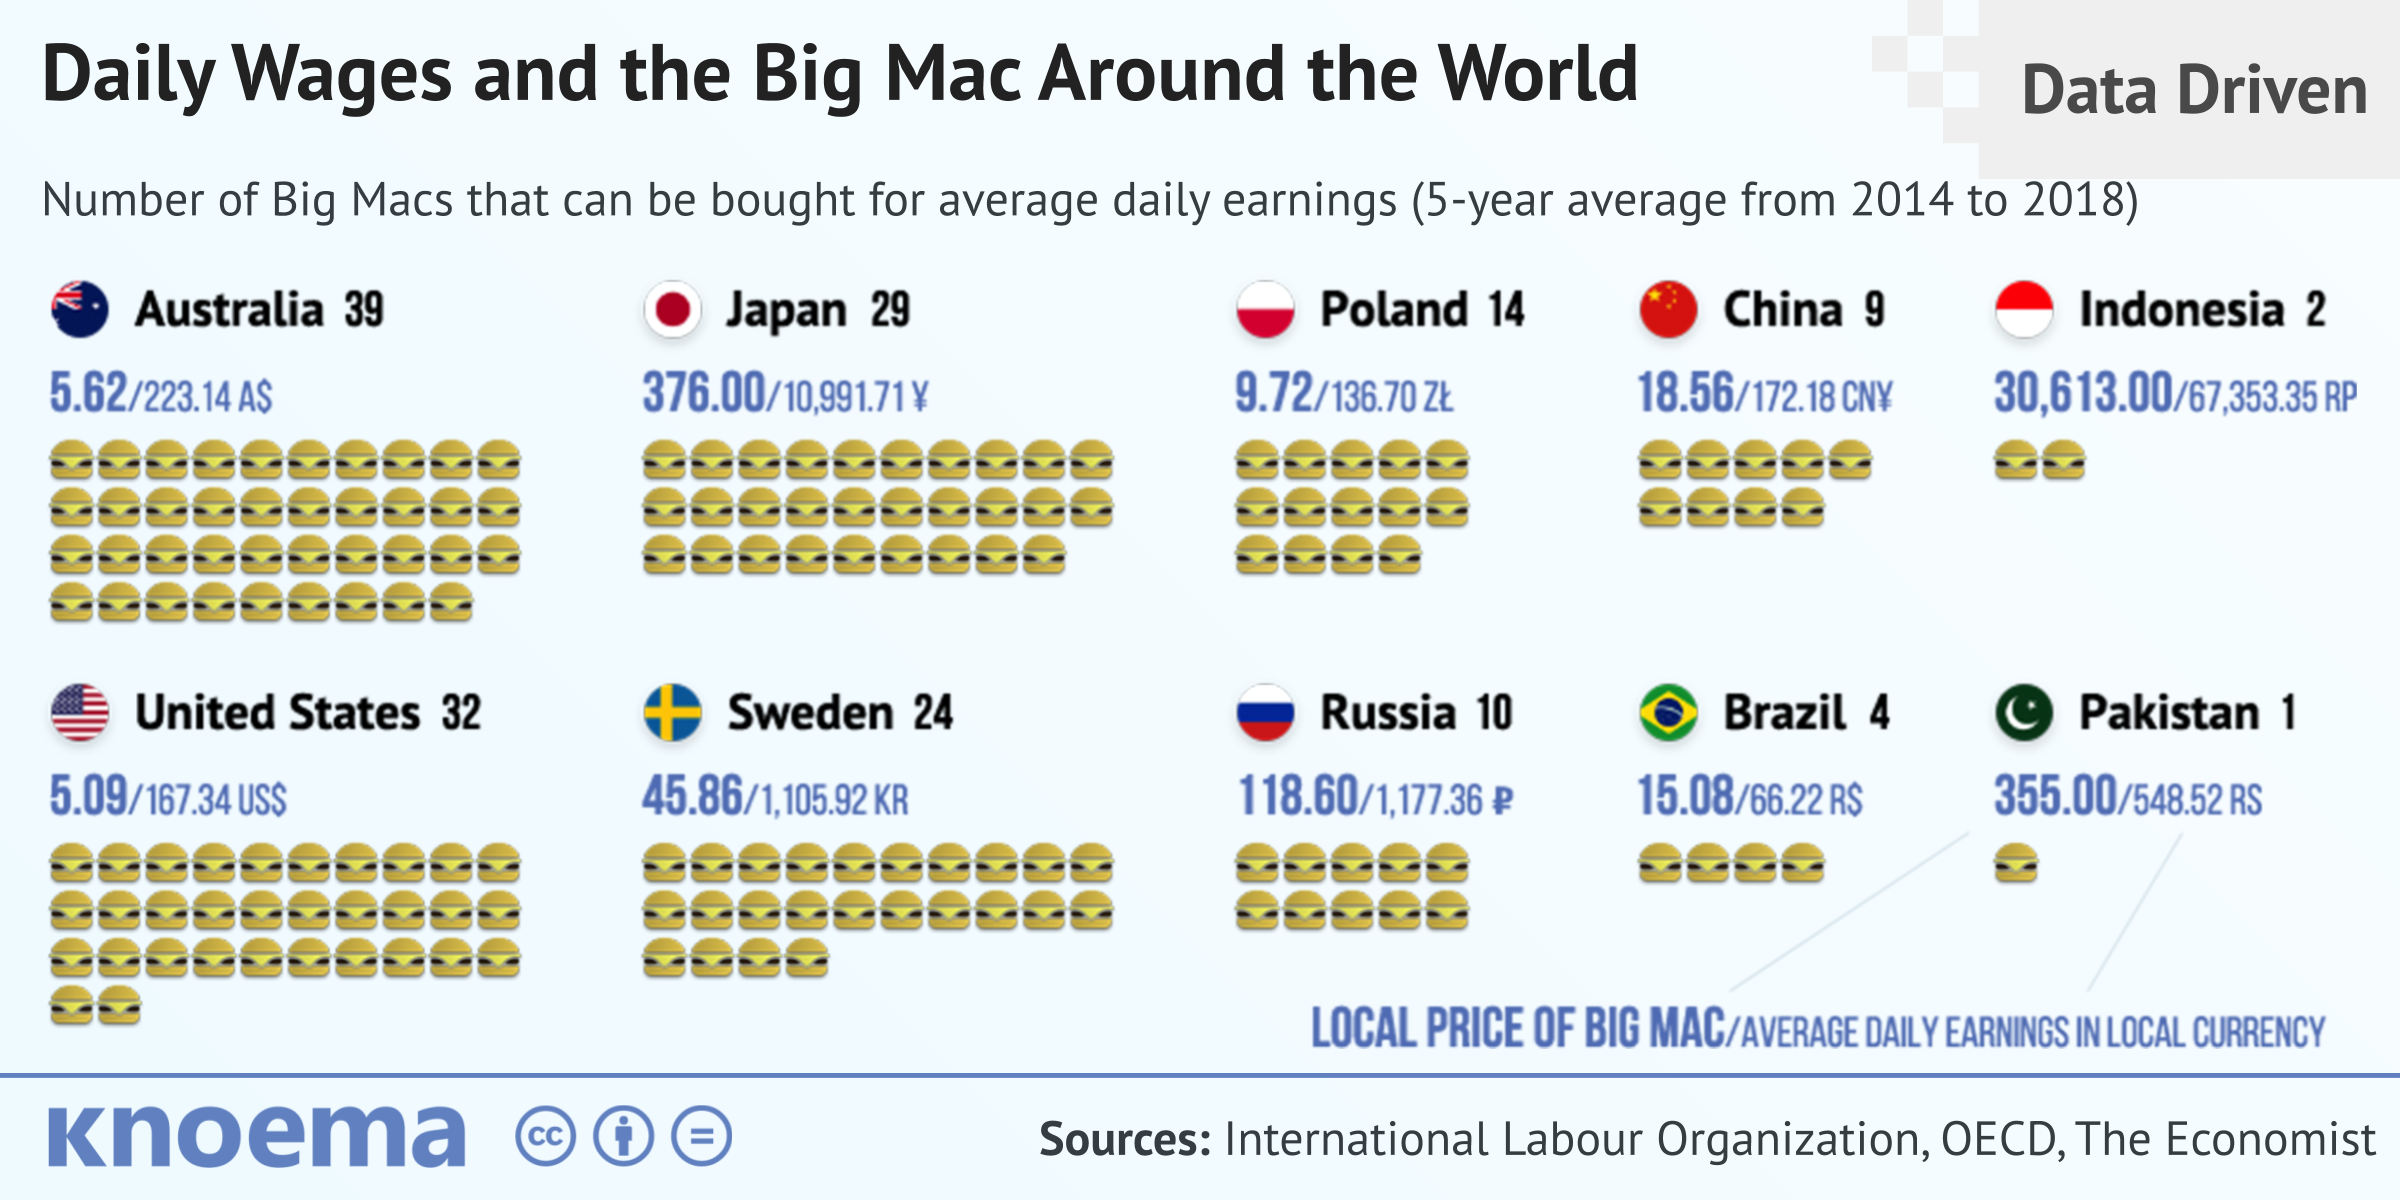
It sounds like a riddle: how many Big Macs for your entire daily wage? Granted, many of our readers may not even have access to a Big Mac where they live (not to mention those who wouldn’t buy Big Macs if they were vegetarian, among other reasons). So, why is the Big Mac Index from the Economist a well-known concept around the world? It’s simple: Big Macs are easier for the overwhelming majority of the world’s population to understand as opposed to economic concepts like “GDP per capita in purchasing power parities,” which is a mouthful and a complicated concept. The answer to the riddle of course depends on many factors, including where you live.

  • In the United States, the home of the Big Mac, the average daily wage would afford you 33 burgers. That’s a lot of burgers. And, yet, in Australia, you could get 40 Big Macs despite the fact that the GDP per capita in the US is roughly $10,000 higher than in Australia.
  • Let’s venture to a lesser developed country with far lower average earnings: Pakistan. In Pakistan, local average daily wages would not even get you two Big Macs. You get the idea.

Traditional metrics, like GDP per capita in purchasing power parities (PPPs), may give a sense for the economic well-being of populations but they also require training to interpret: what exactly does it mean, or does it even matter, that the difference in GDP per capita between the US and Australia is $10,000? It would be more straightforward to think in terms of how many goods - Big Macs or otherwise - a person could purchase with his or her wage. In the case of the Big Mac Index, simply divide the average daily earnings of each country’s workers by the local price of a Big Mac, and compare. You’ve now accounted for differences in price levels and mean earnings and you have a measure that is friendlier to interpretation to the masses. What’s lacking?

  • A Big Mac is a single product (good) versus a basket of goods that would better approximate real consumption.
  • No one claims a Big Mac measure should replace traditional metrics such as GDP per capita. Life simply is more complicated than that. We cannot directly compare GDP per capita and the number of Big Macs per day because GDP includes not only compensation of employees, but also net profit of corporations and taxes, for example.

But, for today, let’s indulge. In our visualizations below you can examine the economic performance of a variety of countries based on local Big Mac prices as well as traditional economic measures. We’ve also introduced a bit more complexity with the addition of the concept of the relative productivity of workers. In general, as you will see below, workers' Big Mac purchasing power is positively correlated with worker productivity, measured in GDP per employee.

Coronavirus Data and Insights

Live data and insights on Coronavirus around the world, including detailed statistics for the US, EU, and China — confirmed and recovered cases, deaths, alternative data on economic activities, customer behavior, supply chains, and more.

Related Insights from Knoema

The World's Largest Economy: China vs United States

Which is the world's largest economy, China or the United States? As is usual in the field of economics, “It depends.” It depends on the methods used to estimate the size of an economy and to compare one economy to another. Despite modern discussions on refining the calculation of gross domestic product (GDP), the standard measure of an economy’s size and performance, to be more inclusive of economic factors that have been ignored to date, such as environmental and natural resource depletion, there is no commonly accepted alternative to GDP. There are, however, at least two commonly...

How Deep an Economic Decline Can the World Expect in 2020?

For the first time during the post World War II era, the global economy is expected to shrink due to measures in force worldwide to suppress the coronavirus, according to the IMF World Economic Outlook (WEO) released on April 14, 2020. In this edition of the WEO, the IMF shortened the forecast horizon to 2021 instead of the expected 2025 horizon and limited the number of indicators available in its statistical tables because of the high level of uncertainty in current global economic conditions. In the baseline scenario—which assumes that the pandemic fades in the second half of...

The Shadow Economy in Europe and OECD Countries in 2003-2015

The $9.7 trillion global shadow economy is the second largest economy in the world after the United States, according to the 2010 estimates of the black market for 162 countries. Still, as for the more recent study, the size of the underground economy in European and other OECD countries have been decreasing steadily since 2009 and continued shrinking in 2015 averaging to 16.7 percent of official GDP. But this development was not uniform across individual countries: 10 out of 36 OECD countries experienced an increase in the black market size in 2015. The most significant upsurge of...

Global Events and the Economic Policy Uncertainty Index

Every day events around the world cause ripple effects that affect global, national, and local levels of economic and political uncertainty. Recent mainstream examples include US sanctions against Venezuela, Brexit, the partial US government shutdown, protests in France, and the US-China trade war. As uncertainty rises, we observe markets responding, whether you're tracking stock prices, commodity prices, or even interest rates. Today we have another more comprehensive measure available to monitor these effects: the Economic Policy Uncertainty Index. Developed by a group of...