Export

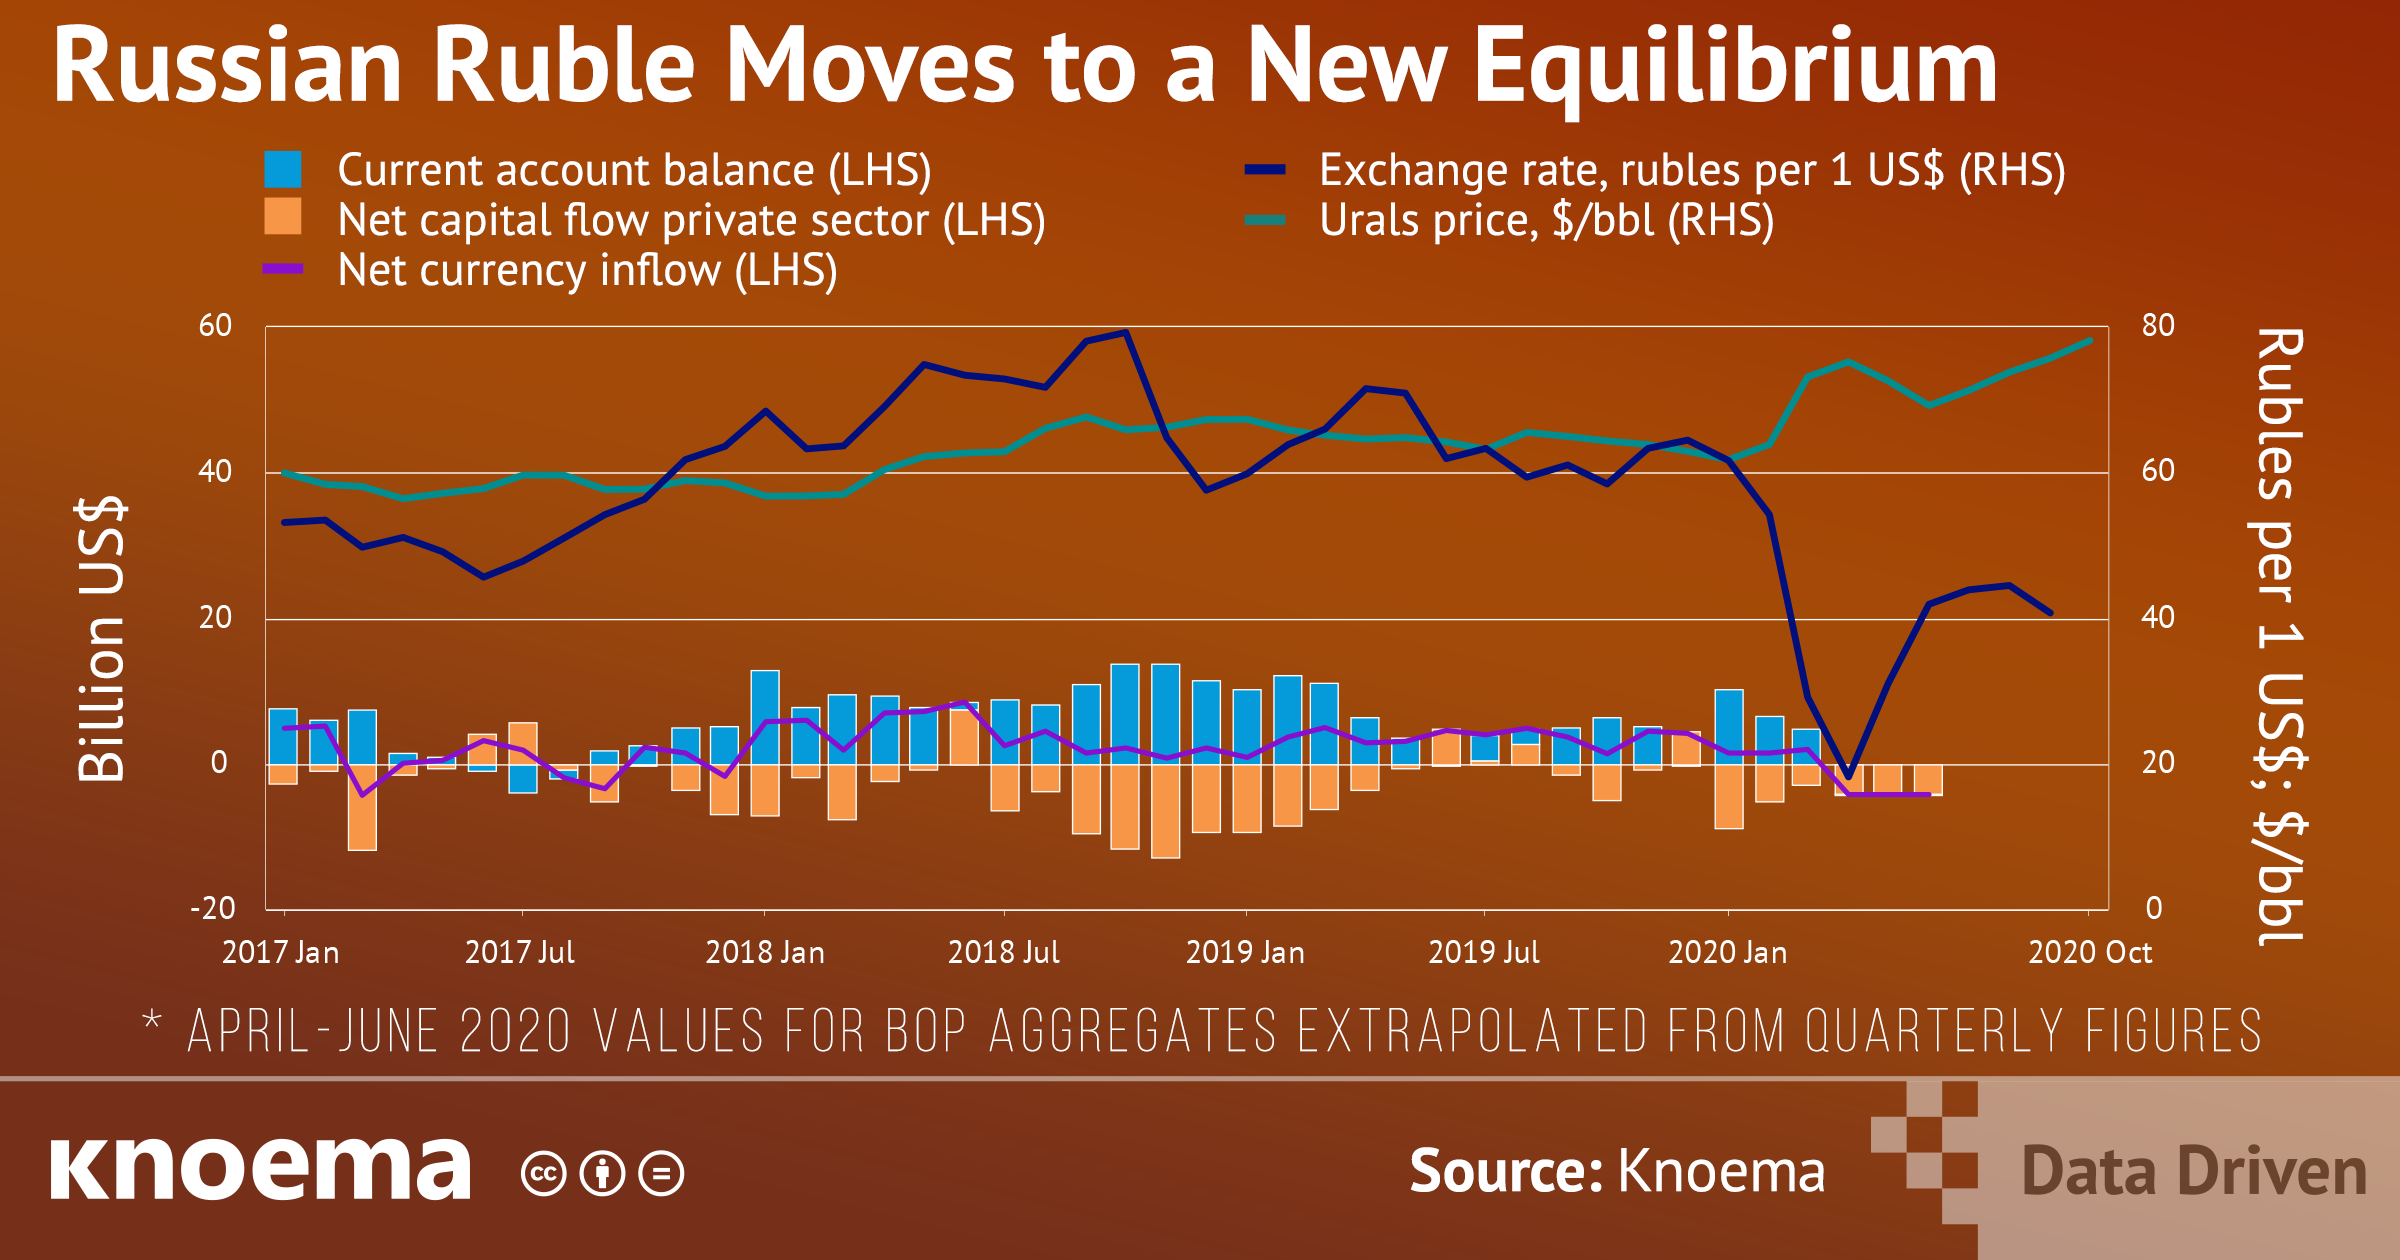
(7 October 2020)  The depreciation of the Russian ruble by 26 percent against the US dollar since March 2020 directly relates to a reduction in the trade balance and capital outflows by the private sector in the wake of anti-COVID lockdowns and a drop in global energy demand and prices. Analysis of the monthly balance of payment statistics from the Central Bank of Russia suggests the outlines of a new equilibrium for the ruble:

  • Russia's current account balance since April has shrunk to zero.
  • At the same time, the Russian Central Bank has cut the policy rate from 6.25 percent to a record low 4.25 percent, which has in turn lowered returns on foreign short-term investment into Russian debt securities and contributed to the outflow of capital to the tune of $4-5 billion per month.
  • Without further intervention from the Russian Central Bank, we estimate that foreign currency flows will rebalance if imports decrease by $4 billion per month, which equates an exchange rate of about 85 rubles per $1 (assuming each 1% depreciation of the ruble corresponds to a 1% decrease in imports).

As a policy matter and economic imperative, the Russian Central Bank has sufficient foreign exchange reserves to prevent the weakening of the ruble to 85 rubles per $1. Despite 30 percent YoY decrease of exports during the March-July 2020 period, Russian foreign exchange reserves grew to a record $595 billion by the end of August 2020, mainly due to the increase in gold prices.

Coronavirus Data and Insights

Live data and insights on Coronavirus around the world, including detailed statistics for the US, EU, and China — confirmed and recovered cases, deaths, alternative data on economic activities, customer behavior, supply chains, and more.

Related Insights from Knoema

Brazil's Current Account Widens to 3 Percent of GDP in October 2019

Brazil’s current account deficit (CAD) widened to US$ 7873.97 million in October as compared to US$ 4139.03 in September 2019, exceeding market expectations. The CAD, percentage of gross domestic product (GDP) reached to 3 percent in October, highest since December 2015. Through the first 10 months of 2019, the deficit reached to US$ 45657.03 million as compared to US$ 32371.94 million deficit for the first 10 months of 2018. Thereby recording 41 percent rise in 2019 as compared to 2018. The CAD print is also impacted by recent revision in methodology for measuring historical...

Russian's Seeking Security in Cash

As the coronacrisis reached Russia this spring, ordinary citizens and business turned to cash to guard against the uncertainties of 2020. By early October, an estimated 12.1 trillion rubles were in circulation. While cash holdings have been on the rise for the better part of the last decade in Russia, the growth rate of cash holdings outside the banking system (a.k.a. M0) quadrupled between March (7.1%) and October (28.3%). The growth in cash holdings during the April-June period was largely COVID-related. Since mid-summer, however, Russian's were likely equally driven to withdraw...

Balance of Payments and International Investment Position Statistics (BOP/IIP)

Balance of Payments (BOP) is a method employed by countries to monitor all international monetary transactions occured during a particular period of time. Usually, Balance of Payments is calculated quarterly and annually. All trades conducted by both the private and public sectors are accounted for in country's Balance of Payments in order to determine how much money is going in and out of the country's economy. If a country has received money, this is noted as a credit, and if a country has paid or given money, the transaction is counted as a debit. Theoretically, Balance of...

India’s Current Account Deficit Contracted Whereas Fiscal Deficit Widened in August, 2019

India’s current account deficit (CAD) was $14.3 billion or 2 percent of GDP in Q1 FY19-20 compared to US$ 15.8 billion (2.3 percent of GDP) in Q1 FY18-19. The contraction of CAD was primarily on account of high invisible receipts of US$ 31.9 billion in Q1 FY19-20 as compared to US$ 29.9 billion in FY18-19. Private transfer receipts, an indicator of remittances by Indians employed overseas, rose US$19.9 billion (6.2 percent Y-o-Y) in Q1 FY19-20 from US$ 18.6 billion in Q1 FY18-19.Net services receipts rose US$ 20.03 billion in Q1 FY 19-20 (7.3 percent on Y-o-Y) from US$ 18.68...