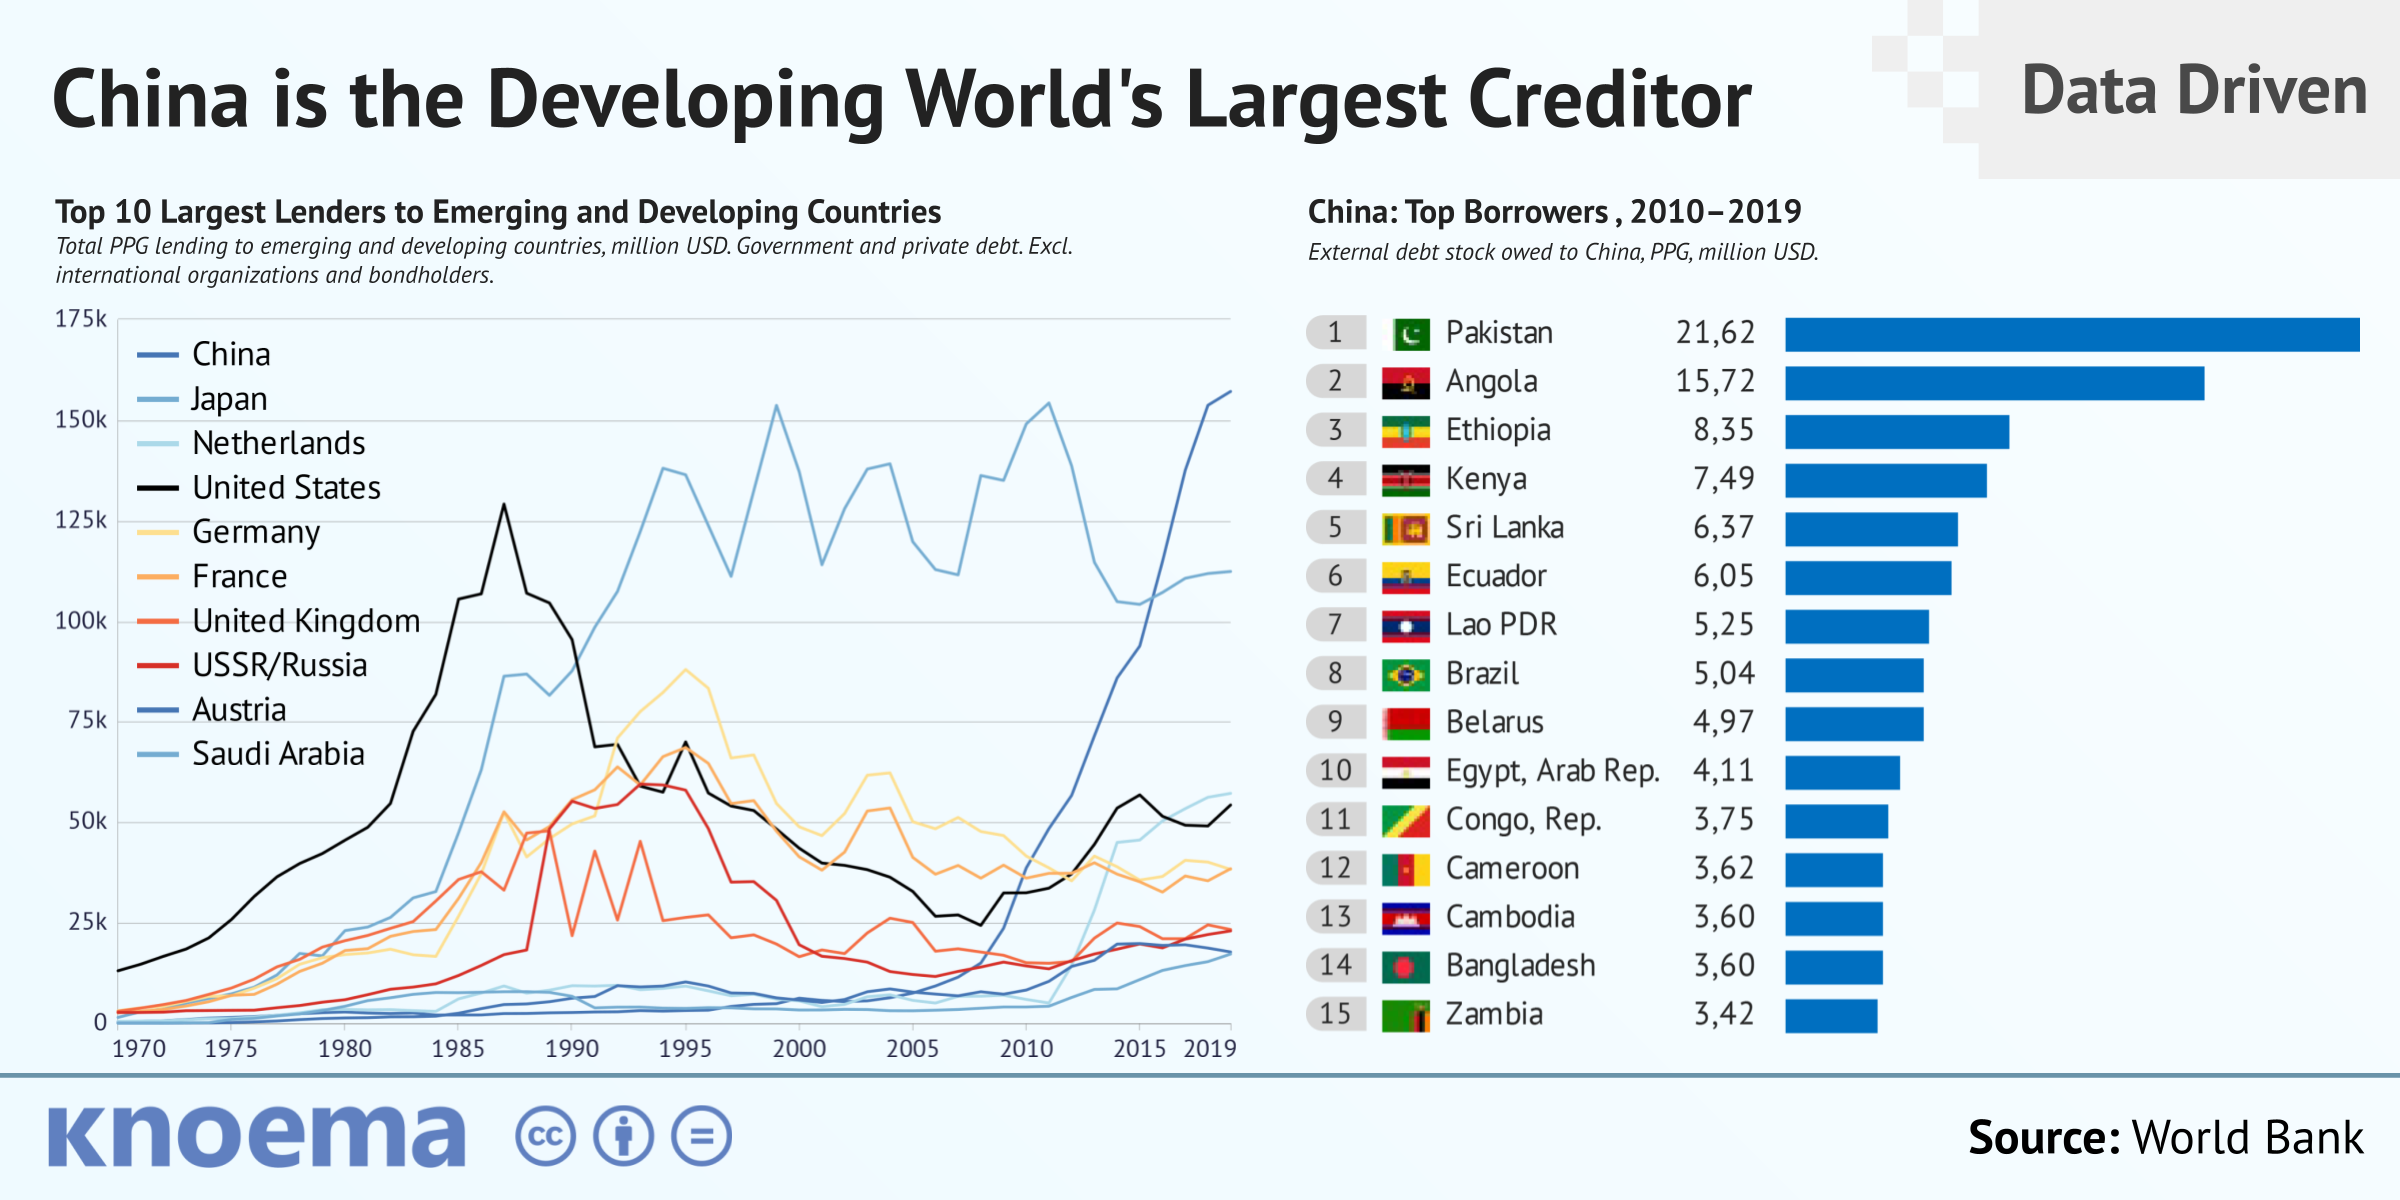
(04 November 2021) As a part its 2021 International Debt Statistics Report, the World Bank has published data on the external debt of emerging and developing countries, broken down by creditors. This data not only reveals countries — the largest single creditors — but can also be used to estimate the financial power of particular creditors within a specific debtor economy. Detailed external debt data from the World Bank is now available from Knoema.

  • The World Bank data shows that since the 2008 global financial crisis China has dramatically increased lending to foreign countries. The total public and publicly guaranteed (PPG) external debt stock of emerging and developing countries that is owed to China increased from $11 billion in 2007 to $157 billion in 2019.
  • Thirty-nine countries owe China over $1 billion. Pakistan,  Angola,  Ethiopia, Kenya and Sri Lanka have the largest debt to China.

The graphs below explore the top lenders to emerging and developing economies, dig into the lending geography and totals of the major creditor countries, and provide detailed profiles of debtor countries. Choose a nation in the drop-down menu below to view country details at the bottom of this page.


Definition: "External debt stock" is the amount of a country's debt borrowed from public or private foreign lenders.

Source: The World Bank data was retrieved from WB IDS API and assembled by David Mihalyi and Balint Parragi.

Related Insights from Knoema

Will Global Debt Expansion Trigger the Next Financial Downturn?

In the 10 years since the 2008-2009 global financial crisis, aka “Great Recession,” the global debt of the non-financial sector increased by 53 percent to reach $178 trillion in the third quarter of 2018, according to the Bank for International Settlements. Global debt, which represents the outstanding credit provided by domestic banks and other institutions to households, non-financial corporations, and government, is quite simply the driver of the modern economy. Over the 2008-2018 period, each percent of GDP growth in G20 countries required, on average, 1.6 percent of debt...

Household Debt in the US

The household debt balance in the United States reached a new all-time high of $13.3 trillion in the second quarter of 2018, according to the latest report from the Center for Microeconomic Data of the Federal Reserve Bank of New York. US household debt has risen continuously since 2013, now constituting 65 percent of US GDP and exceeding the 2008 pre-crisis level by nearly $475 billion. US household debt is indisputably large in absolute terms, now exceeding the GDP China, the world's second-largest economy. Yet, relative to the size of the US economy, household debt is less...

QuERI | The US Federal Debt Outstanding is Just a Number - 27 and 12 Zeros

(02 February 2021) Based on the original paper by Dr. David L. Blond, Principle Researcher and President, QuERI-International. The views expressed are those of the author(s) and do not necessarily represent the views of Knoema Holdings and its Executive Board. In November 2020, US voters went to the ballot box and sent a Democrat back into the White House to stare down a federal deficit that grew under President Trump from $19 trillion in January 2016 to more than $27 trillion the day that Joe Biden was inaugurated. As you can imagine, the deficit hawks are out in force once again....

Eurozone: Governments Are Paying Less for Higher Debts

(05 August 2021) To support the economy and health systems during the coronavirus crisis, governments had to increase spending, financing the increase mostly with growing debt. However, buildup in government debt doesn't necessary lead to the deterioration of fiscal stability, at least not in the short term. Eurozone countries, which on average increased government debt by 14% of GDP during 2020, now pay even less to serve higher debts than they did before the pandemic began. In 2020, government debt in eurozone countries increased by an average of 14.1 percentage points, to 98.4%...